

Research Goals
This project was designed to test the end-to-end user journey of Airbnb Experiences. By auditing nomenclature and iconography, I sought to reduce users’ cognitive load during the discovery phase.
Simultaneously, I analyzed the competitive landscape and customer service touchpoints to define best-in-class features.
The final phase of my research translated these insights into a roadmap for optimization, ensuring a seamless experience across the mobile and desktop ecosystem.
Process
Methodology
I utilized a hybrid research framework to pressure-test the platform’s usability from multiple angles:
In-Depth Interviews: 4 sessions focused on user flows and decision drivers.
Remote Usability Testing: 3 sessions capturing real-time interaction data via UserTesting.com.
Quantitative Research: 2 targeted surveys (Google Forms/mTurk) to validate qualitative findings at scale.
Competitive Audit: Analysis of Nextdoor and Facebook Events to benchmark industry standards for local discovery.
User outreach
Geographic Reach: Focused on Western U.S. markets (California and Hawaii).
Age Range: Targeted a core demographic (Ages 18–45).
Recruitment Goal: To contrast the "expert" workflow of current users against the "discovery" friction experienced by first-time users.
Survey 1 Demographics (N=108)
I conducted a quantitative study to identify the core personas within the Airbnb Experiences ecosystem. The data revealed a distinct Geographic-Gender Split among the 18–40 age bracket:
Suburban Reach: 43% of respondents were female (n=46), primarily concentrated in suburban environments.
Urban Reach: 57% of respondents were male (n=62), with a strong concentration in urban centers.
Survey 2 Demographics (N=98)
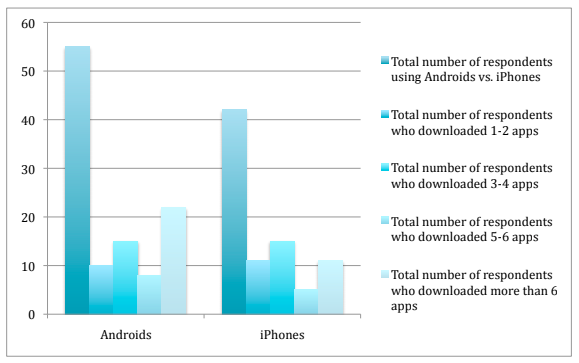
I deployed a second quantitative study to audit mobile ecosystem preferences. With a distribution of 57% Android users and 43% iOS users, the findings underscored the necessity of a design strategy that prioritized platform-specific UI conventions.
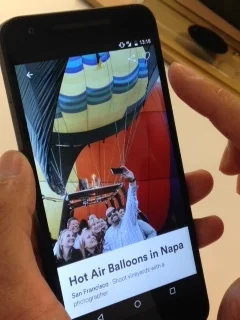
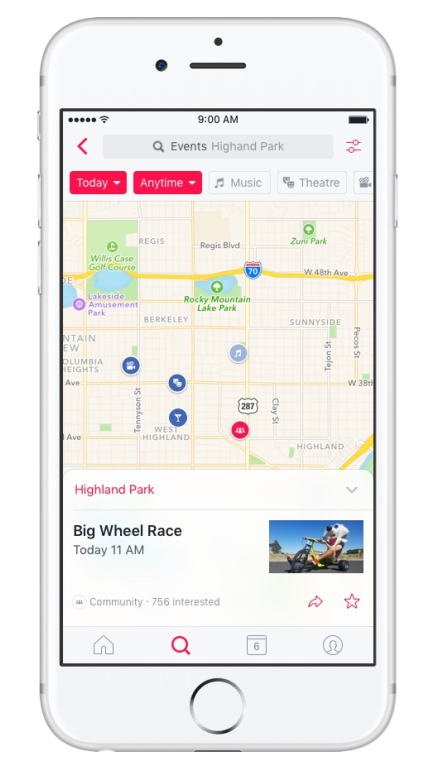
““This photo has a light background, and the icons are light, so it doesn’t stand out.””

Key Usability Findings
My qualitative deep-dives revealed three systemic barriers to entry within the current user journey:
Taxonomy Confusion: 100% of in-person participants (4/4) exhibited confusion regarding the “Experiences” nomenclature, failing to distinguish the service from standard home rentals.
Visual Accessibility Gaps: 50% of participants (2/4) identified the iconography as a cognitive burden, citing low visibility as a primary deterrent (see highlighted example).
Navigation & Filtering Friction: 50% of users (2/4) encountered significant abandonment risks while attempting to use filters, indicating a mismatch between the current filter logic and user mental models.
Market Intelligence
To benchmark Airbnb’s positioning, I measured current user behavior regarding event discovery through my survey. The data revealed Facebook’s overwhelming market dominance, identifying it as the primary competitor to the "Experiences" ecosystem:
Market Leader: Facebook emerged as the definitive incumbent - 91% of respondents reported it as their primary search tool.
Niche Player: Nextdoor maintained a significantly lower footprint at only 10%, suggesting its utility is confined to hyper-local or neighborhood-specific use cases.
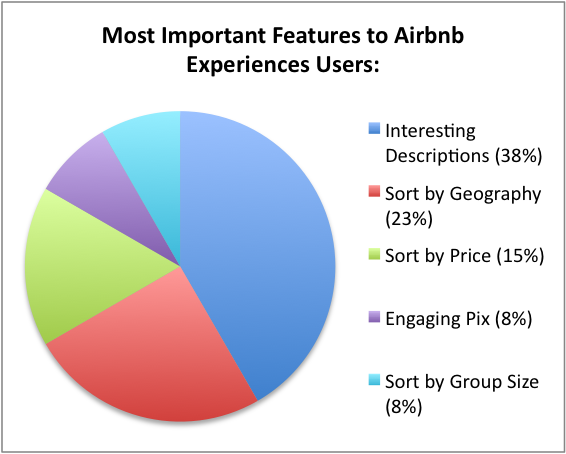
User Preferences
Value-Driven Pricing: Survey respondents demonstrated low price sensitivity, suggesting that the perceived unique value of an Experience outweighs cost as a primary decision driver.
Optimal Capacity: For standard 1–2 hour sessions, users identified a maximum group size of 10 as the threshold for maintaining a high-quality, intimate social environment.
Experience-Seekers: Findings suggest that users are looking for curated novelty, wanting a "premium-special" interaction regardless of their geographic location.

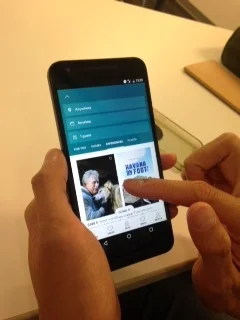
““Oh my goodness! Why isn’t it in Help? That doesn’t make any sense. I’ll just use Google.””
Critical Friction: The Support Discovery Gap
My research identified a significant breakdown in the Help Center journey. The current architecture fails to meet user expectations for in-platform support, creating a reliance on external workarounds:
Support Discoverability: 100% of in-person participants (4/4) were unable to locate support contact information within the UI, indicating a "dead end" in the user journey.
User Sentiment & Retention: Quantitative data revealed that 50% of users would be “Highly Dissatisfied” by an inability to resolve issues in-app, marking this as a high-risk factor for user churn.
External Workarounds: Qualitative testing surfaced users resorting to third-party search engines (Google) to find help—a behavior that erodes brand trust and fragments the user experience.
Mental Model Alignment: A majority of respondents identified the "Help Section" as their primary expected location for support, suggesting a clear opportunity to align UI navigation with existing user intuition.
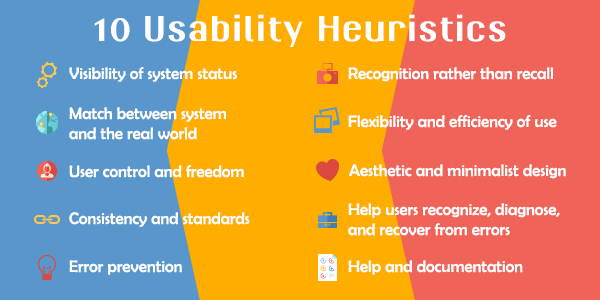
“Help” is one of the top 10 usability design heuristics identified by UX guru Jakob Nielsen.

The Planning vs. Booking Paradox
My research identified a significant discrepancy between general social behavior and actual Airbnb Experiences conversion:
General Behavior (The Planners): Survey 1 established that women are the primary drivers of social planning, with 74% of respondents identifying females as the lead organizers in their social circles (compared to 65% for males).
Platform Reality (The Bookers): Despite their role as planners, women represent only 20% of Airbnb Experience bookings, while males account for 80%.
Implication: This suggests a "Conversion Friction" for the primary planning persona. There is an opportunity to grow market share by identifying why the primary organizers (females) are not the ones finalizing transactions on the Airbnb platform.

Cross-Platform Usage & Hardware Insights
My research identified a significant mobile adoption gap between Airbnb Experiences and the broader market:
The Desktop Constraint: In Survey 1, Airbnb Experience users reported exclusively utilizing large-screen devices—80% Laptop and 20% Tablet—representing a total absence of native mobile engagement during the booking phase.
The Competitive Delta: In contrast, 63% of Facebook users engage via mobile, indicating that Airbnb is missing a critical "on-the-go" discovery market.
Hardware Distribution: Survey 2 revealed that Android users exhibit higher app-download intent than iOS users, with Samsung emerging as the dominant hardware provider.
Recommendation: To compete with Facebook’s mobile dominance, Airbnb should prioritize an Android-first mobile optimization strategy, specifically tailored to the Samsung ecosystem.

Opportunities
Information Architecture & Wayfinding
Nomenclature Clarification: Supplement the “Experiences” branding with a descriptive tagline to bridge the mental model gap identified in 100% of initial tests.
Integrated Search Logic: Converge “Lodging” and “Experiences” into a unified filtering ecosystem. Prioritize a Location-First architecture (Place > Category > Refine) to mimic natural travel planning.
Iconography Standards: Execute a visual audit to increase scale and contrast ratios, ensuring adherence to accessibility standards.
Service Design & Operations
Capacity Constraints: Implement a cap of 10 participants for short-form (1–2 hour) events to preserve the "intimacy" value proposition.
Service Recovery (Help Center): Rebrand support as “Help” to align with user intuition. Beyond FAQs, I recommend a Human-in-the-Loop model (live rep access) as a premium differentiator to build platform trust.
Ecosystem & Persona Growth
Cross-Platform Parity: Prioritize high-performance builds for both iOS and Android, with a specific focus on Samsung hardware optimization to capture the active mobile market.
The "Planner" Initiative: Tailor content strategy and sharing features toward the Female "Social Planner" persona to close the 80/20 gender booking gap.
Proposed Research Road Map
Conversion Optimization: Conduct A/B testing on nomenclature variants to identify which tagline most effectively reduces initial cognitive load and clarifies the value prop.
Platform Friction Audit: Execute a deep-dive investigation into mobile-web abandonment to determine if the 100% desktop/tablet booking rate is a user preference or a result of technical friction on smaller screens.
Persona-Driven Engagement: Launch targeted tests for "The Planner" persona, evaluating content strategies and collaborative booking features designed specifically to increase conversion among female users.
Pricing Strategy: Expand research into price-point tolerance for mid-length (3–4 hour) events, establishing the relationship between duration, group size, and perceived value.
Accessibility Validation: Perform iterative usability audits on high-contrast, scaled iconography to ensure the interface meets universal accessibility standards without compromising brand aesthetic.
Integrative IA Exploration: Conduct Card Sorting and Tree Testing to determine the optimal hierarchy for a merged "Lodging & Experiences" filter, ensuring a seamless cross-category search experience.